

A Web of 68,396 NeurIPS Citations
A Web of 68,396 NeurIPS Citations
Recovering topic-level structure from graph clusters


Before I flew back to the Midwest for winter break, I met up with a friend of mine who’d been gone most of finals week for NeurIPS ‘23. For those not in the machine learning field, NeurIPS is one of the most prestigious conferences in the field, and the one takeaway I had from that conference was that it had become colossal. How massive? Given my sudden windfall of free time, I decided to map it out.
Aggregate Statistics
I first catalogued all NeurIPS papers indexed in Semantic Scholar, allowing me to chart out how many papers were published per year.

I then spent two nights hammering the Semantic Scholar citations API, allowing me to retrieve a mostly accurate* picture of each paper’s references. I turned these references into a huge edge list (published here, see note on inaccuracies below) and ran Gephi’s graph edge visualizer to produce the beautiful image above. Immediately I was struck by the substructure apparent in the ForceAtlas layout of the graph and went to investigate further—this is going to be a picture-heavy post.

For a brief sanity check I showed the distribution of the number of NeurIPS papers cited by each NeurIPS paper. These skew on the lower end, with about half the papers citing less than four other papers from previous conference proceedings.
*Notably I figured out that in fact some NeurIPS papers did cite more than 100 sources, meaning I need to re-aggregate data to take that factor into account. Will update this post when that’s complete!
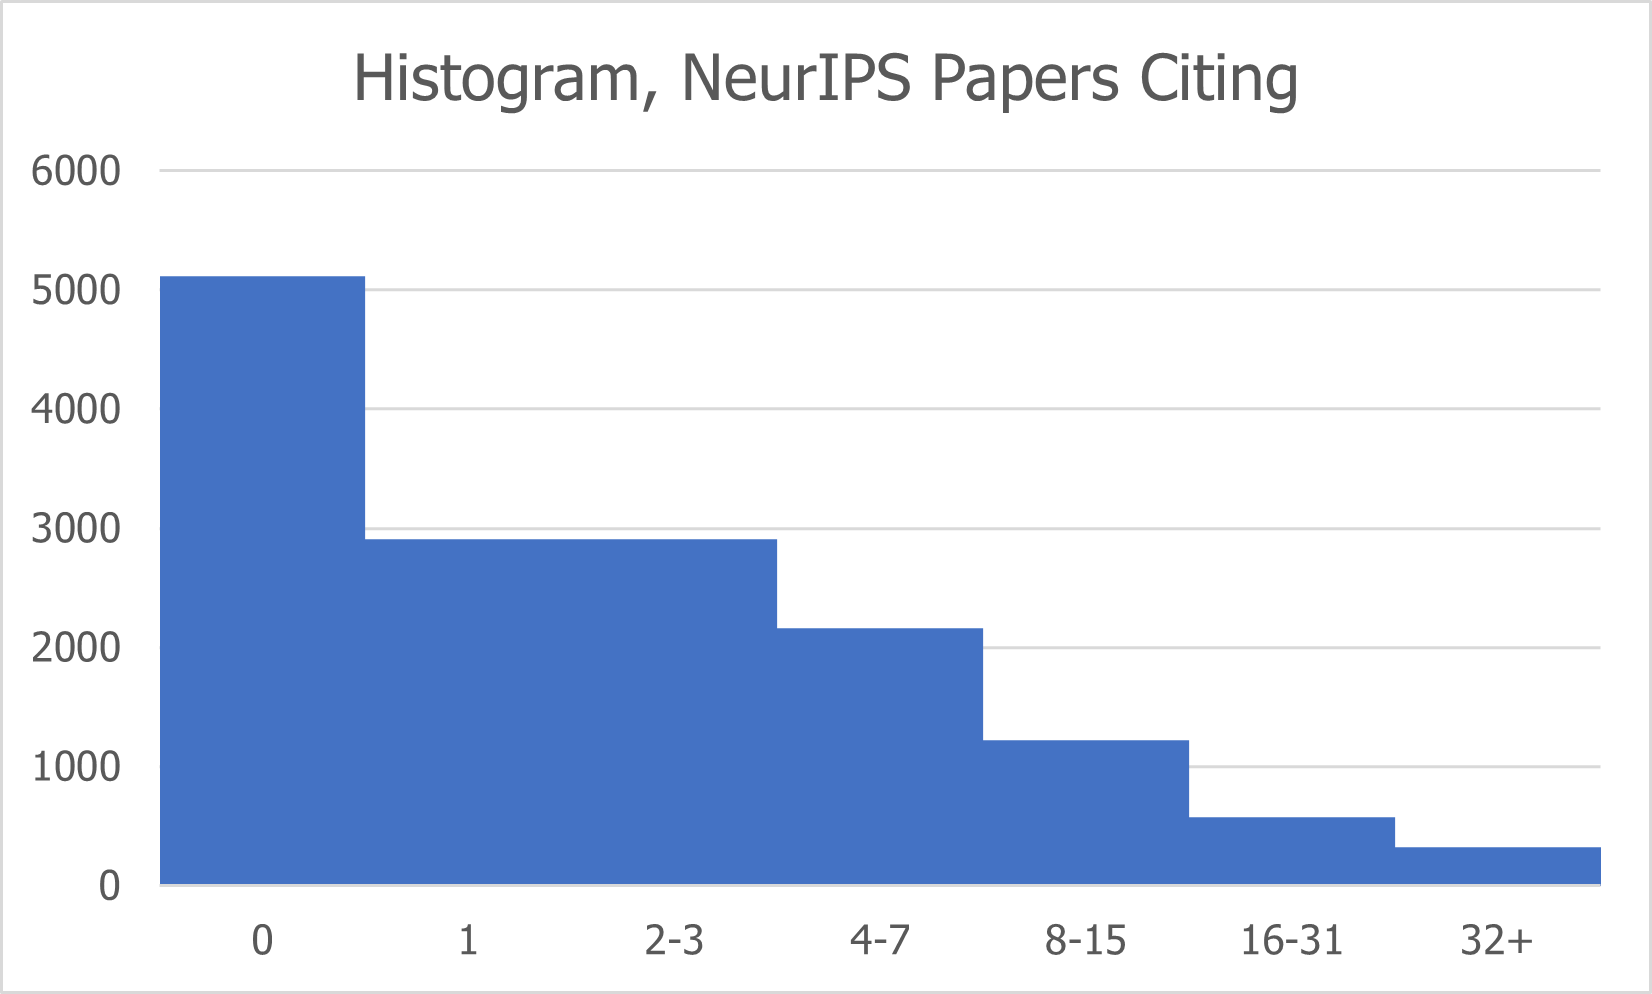
Most NeurIPS papers are also not cited by many other NeurIPS papers. We see many papers with zero NeurIPS citations: one could expect this to contain all 2,834 papers from 2022, which accounts for nearly half that number. A few papers are cited by an exceptional number of other submissions: let’s find out which ones!
Top and Recent Papers

The #1 paper is, understandably, Attention Is All You Need (2017) with 1014 citations, followed by the PyTorch paper (2019) with 720 citations. Citations drop by a factor of two for third place, Language Models are Few-Shot Learners (2020), with 353. Notably, these papers all are in the same dense neighborhood, raising the question as to what defines these neighborhoods in the first place. Two hypotheses come to mind:
Neighborhoods are defined by the age of the work: works which are hyper-cited tend to draw works that post-date them into their neighborhood.
Neighborhoods are defined by the subfield of work that’s being done, with works in the same subfield more likely to cite each other.
These are testable hypotheses! I wrote a script to label all points by year of publication and colored all data points after 2017 (publication of “Attention Is All You Need”) in cyan. The result is shown below:

We see a wide distribution of cyan on our image, showing that our hypothesis is at least not totally correct. There is a conspicuous lack of cyan in specific outlying parts of the graph, though—more on that later. The logical next step is to analyze the properties of works neighboring each other. From now on, the attention and PyTorch papers will be highlighted as references so you know what part of the graph you’re looking at. All analysis will also be done from the non-rotated graph.
Neighborhood Analyses

Out of curiosity, I choose Diffusion Improves Graph Learning as my reference paper, which has only been cited by 23 other NeurIPS papers. Since this focuses on graph neural nets and diffusion, I expect it to be somewhat far from the attention paper. Nevertheless, upon analysis it falls within the same large area. After a query, I find the large dot next to it (also highlighed in cyan) is Inductive Representation Learning on Large Graphs, suggesting that that neighborhood represents work in GNNs. What about clusters apart from the main cluster?

The paper highlighted at far right is Random Features for Large-Scale Kernel Machines (2007). The cluster around it has few recent papers, as shown in the cyan visualization, which makes sense since deep learning has mostly displaced kernel methods in current work. The one below, more embedded in recent papers, is Neural Tangent Kernel: Convergence and Generalization in Neural Networks (2018), which links kernel methods with neural networks. Since this work focuses both on deep learning and kernel methods, it makes sense that it’s surrounded by newer papers and about equidistant between the large deep learning cluster and the kernel cluster. What about outlying papers at the top of the map?

In brown I highlight the classic Sutton paper: Policy Gradient Methods for Reinforcement Learning with Function Approximation (1999). Even further out, and cited 161 times, is Improved Algorithms for Linear Stochastic Bandits (2011). This seems to suggest that the northern arm on this map is a cluster of reinforcement learning papers, especially classic RL results not paired with deep learning.
Recap
Here’s what we’ve found so far:
NeurIPS papers are densely connected by co-citations (98% are in the largest connected component, and network diameter is 18).
While most papers only cite or are cited by few NeurIPS papers, a few heavy-hitters have hundreds or thousands of citations at the conference.
A ForceAtlas 2 layout of the graph exposes clusters which, upon inspection, correlate closely with specific areas of study. These clusters tend not to correlate with publication year.

To my knowledge, this is the first exploration of the citation graph structure of an academic conference. I wonder if the underlying structure could be used to better explore existing literature: arXiv is notoriously colossal, and I don’t know anyone who actively uses Connected Papers. I hope this data, in the hands of the right person, will improve the discoverability of vast amounts of scientific insight.